Agriculture, Animal breeding, genetics, farm livestock improvement, theory, population genetics, variation, selection, culling, genetic gain, breeding methods, heterosis, selection aids and methods
By Dr D.C. Dalton
Part 111. POPULATION GENETICS
Selection and Breeding
The complexity of traits in farm animalsMost of the economic traits that breeders have to consider in farm animals are not simple and their inheritance cannot be explained by the techniques of Mendelian genetics. Consider for example an apparently simple trait like weaning weight in sheep. The various factors affecting it are shown in fig 12.Here arrows are used to show the links between the various factors. It can be seen that genetic factors are involved in the ewe's fertility, milk production, lamb weight and its growth from birth to weaning - really from conception to weaning. It is also obvious that the environment has an important effect on many of these.
It is in dealing with traits like this that farm animal breeding is concerned with the branch of genetics called 'population genetics'. The terms quantitative genetics or biometrical genetics may also be used. This branch of genetics deals with traits that are controlled by many genes (referred to as polygenic) and where large numbers of animals(or populations) are involved. These populations may be individual flocks or herds, groups within these, or perhaps even the entire national flock or herd. However, although the population becomes the main concept, the individual within the population is still important.
THE BRIDGE BETWEEN MENDELISM AND POPULATION GENETICS
It seems to be at this point of bridging the gap between Mendelism and population genetics that most students have difficulty, and doubtless the explanation of what is going on at the level of the animal's genes has not been clearly explained. Mendelism has not stopped and something else started - the Mendelian actions of the genes carry on.
The problem is that explaining their complexity using Mendelian - techniques is difficult. To illustrate this, consider the situation with fleece weight in sheep -taken because it isafairly simple character compared to many others the breeder has to deal with.
Assume that it is controlled by two pairs of genes Aa and Bb. Each of the genes A and B adds 0.lkg to the basic genotype value of 5.0kg for aabb. Genes a and b add nothing. So aabb is the base line and it produces 5.0kg of wool. Also, and this is very important, the environment is taken to have no effect. Thus:
Then when F1 animals are crossed, the results for the F2 are these:This exercise highlights two important points:
(a) The mean of the F2 is 5.2kg which is the same as the mean for the F1.
(b) However, in the F2 a great deal of variation has appeared, the fleece weights range from a low of 5.0kg to the high of 5.4kg.
Note also that further variation could be included into these weights by environmental factors and the effect of this would be to increase the spread even more. This then is the link with population genetics: the discussion of variation.
Population genetics: variation
Population genetics starts with the study of variation and asks the question what is causing this variation in a group of animals. Why for example do the weaning weights of a group of lambs vary? In traditional breeding terms, variation in animals appeared to be something to get rid of as quickly as possible and breeders considered success as being able to breed animals like 'peas in a pod'.
This was mainly thought of in terms of physical features, i.e. the animals had to look alike and animals that looked different were considered to be inferior. This fact of looking alike may not be important in practice but animals that perform similarly certainly have advantages: they can be fed, slaughtered and processed in a standardised way and hence have economic advantages.
Geneticists consider variation as the raw material for improvement; variation that is both visible (phenotypic) and invisible (genetic). The breeder's tool to work on this variation is selection. So basically, population genetics is all about variation and selection.
VARIATION: HOW TO DESCRIBE IT
Probably the easiest way to understand variation in a flock or herd is to draw a diagram of it (called a distribution) for a particular trait. Good examples would be the live weight at a specific age, fleece weight, milk yield, etc., of a group of animals. There should be a reasonable number of animals in the group, say at least 15 -20. Fertility and survival should be avoided as these are different and are considered later.
An example used here is the live weight of 2500 young Romney rams at 15 months of age. Firstly, the group sizes were chosen (a 2 kg range was taken), and the number of animals that fell into each class was counted. This is shown in fig. 13 and is called a histogram. It can be seen that the columns are very even on both sides of the middle one which is the average or mean weight of 49.5 kg. A very smooth bell-shaped curve can then be drawn through the tops of the columns to describe the distribution instead of drawing all the columns.
This curve, first described by the German mathematician Gauss (1775 - 1855) has some well recognised features that are the bases of population genetics (shown in fig. 14). The curve is described as a 'normal' curve or the 'normal curve of distribution'. Its features are these:

- The curve describes a mean and the variation spread around it.
- The vertical lines drawn from the shoulders of the curve where the slope changes direction enclose an area in which about 68% of the observations will be found. These lines may be called truncation points.
- The shaded area can be defined more precisely in statistical terms by saying that it is one standard deviation above, and one standard deviation below the mean. The Greek letter sigma is the mathematical notation for standard deviation.
- In the area described by the mean plus or minus 2 standard deviations, there will be about 95% of all the observations and the mean, plus or minus 3 standard deviations will cover about 99% of all the observations.
- Thus the mean and standard deviation can quickly describe the variability of a group of animals. This also introduces the concept of describing individual animals by their differences or deviation from the mean. This is the above- or below-average concept that is the basis of animal improvement.
OTHER SHAPED CURVES
As stated earlier, the standard deviation is a useful guide to the shape of the curve for a trait and examples are shown in fig. 15. All these distributions described so far have dealt with situations where variation is continuous from one side of the distribution to the other.
This situation is very readily recognised on the farm where, for example, there are always some very poor milkers relative to the herd average, the majority are about average and there are some really high-yielding cows. This is called continuous variation.
In some traits, and the best examples are survival and fertility, the variation is not continuous and is referred to as discontinuous or 'discrete' variation. In survival for example, an animal is either dead or alive so there are only two classes. The fertility of cattle or horses, measured by numbers of offspring born, is usually 1 or 0 since multiples are not common.
In sheep, pigs or any animals that have litters, however, the distribution could look like fig. 16 where it can be seen that animals either have no lambs (0) or some lambs i.e. anything from one up to six lambs in sheep and many more offspring in pigs. In fig. 16 the mean is about 0.5. This is called a 'skewed' distribution i.e. it appears as a distribution that has been 'pushed over'. These skewed distributions have different statistical features to normal distributions(Ref 13).
THE CHALLENGE : TO IMPROVE THE MEAN
The real breeding challenge in a flock or herd is to improve the mean performance for a trait or a number of traits, and also to try and reduce some of the variation. Unfortunately in the livestock industry, most of the glory seems to be associated with breeding a few individuals that may win ribbons in the show ring or make a record price. These outward signs of success are easy to feature whereas small increases in mean performance may not be, although on a national scale the latter will give greater economic benefit.
WHERE TO START?
Once an animal's performance has been measured for a character and its position relative to the mean of the whole group established, then the first question should concern the reason for its actual position. This is simply to find out if the animal's performance was due to its genotype or to some environmental factor. Any comparisons among animals assume that they were all treated alike as far as the management would allow.
Consider an example where a decision has to be made on a beef heifer with a poor (below average) 550-day weight. Why is it in the poor end of the herd distribution? The possibilities are these:
- The heifer had a low birth weight because its dam first calved at two years of age instead of three years of age, and was also poorly fed before and after calving.
- The heifer's dam gave very little milk and consequently was a poor mother, so the heifer was prematurely weaned at a very light weight.
- Because the heifer was a poor weaner, it was ravaged by worms, insects and ticks that all helped to restrict growth and hence 550- day weight.
This is a list of 'environmental' reasons and could include many more. However, if this beef heifer were mated even to an average bull, then its progeny could show a definite move upwards towards the mean. On the other hand an animal at the opposite end of the distribution (the + end) could have had all the environmental luck going, and its breeding performance could be much worse than expected. This is a well-known phenomenon in animal breeding and is accepted as part of the hazards of the business.
Statistically this is described as a regression (or return) to the mean. In practice it means that if the superiority of an animal in a population is due mainly to a good environment, then the improvement of mean performance through genetics will be harder. If the expression of the animal's performance is due to good genes, then the breeder can proceed to make decisions with much more confidence that what he sees will be passed on to future generations.
COMPARISONS BETWEEN POPULATIONS
Making comparisons between animals in different populations is difficult and basically should not be done unless it is known where the populations lie on some overall distribution of breeding merit.
The reason for this is that because different populations (flocks or herds) are run on different farms with different feeding and management, then these environmental effects reduce the validity of the genetic comparisons between the animals. The comparison thus is between stockmen and not the stock.
More technically, even if the deviation of each animal from its flock mean were used in a comparison, that comparison would be invalid because the means are different. This can bevery frustrating for a commercial ram buyer, for example, who may be looking at rams on different farms and may want to compare an above-average ram on a poor farm with an average ram on a
good farm. He cannot tell whether he is comparing environments or genetics.
This opens up a wide general subject of comparing animals which is discussed later. At this point it is sufficient to say that attempts to get round the problem are either to put all the animals into a 'common environment' for comparison, or to have the same reference animal (used through semen) in each environment. The main point to stress is that comparisons should be made among animals within a flock or herd and not between flocks or herds.
SELECTION
Selection can be simply defined as allowing some animals to be parents of the next generation while depriving others of the privilege. Thus castration was one of the earliest forms of selection. What selection actually does is to change the frequency with which certain genes (or combinations) occur in a population. This is the concept of gene frequency that is dealt with fully in all texts on population genetics (Refs 15 and 16).
A hypothetical situation is where all the 'bad' genes have a low frequency or are rare and all the 'good' genes have a high frequency or are plentiful. However, in practical breeding selection is really about making decisions. It can be defined as 'choice based on information', the information often ranging from solid fact right through to complete guesswork.
ARTIFICIAL AND NATURAL SELECTION
Artificial selection means selection made by the breeder. It contrasts with natural selection where man allows 'nature to take its course'. This natural selection was the core of Darwin's work in which he developed his theory of the origin of different species.
In modern agriculture there seems to be very little left that could be described as truly natural so breeders are concerned mainly with artificial selection. Recently breeders in some countries have made positive attempts to exploit natural selection. These breeders claim that traditional practices have made farm animals 'soft' or have lost 'constitution' - both difficult words to define scientifically.
Nevertheless, these breeders argue that animals now seem to require more feed, more drugs and more care than they used to, so they are opting for an 'easy-care' or 'no-care' approach. They are doing this by selecting the animals that survive, making sure that they are unassisted by man in really tough commercial conditions.
This approach could be expanded into selection for disease resistance, for example, by deliberately exposing breeding stock to pathogens (disease organisms). An example is the selection for tick resistance in the Australian Milking Zebu (AMZ) where animals were deliberately infested with a known number of ticks and the ticks that gorged and then dropped off were counted.
Poultry breeders have been especially concerned about selecting for disease resistance and have made progress by deliberately challenging the stock with some of the major disease pathogens. However, this whole easy-care approach assumes that the genetic qualities that the breeders want are genetically controlled. At present there is little hard evidence to verify this but plenty of circumstantial evidence from breeders that their approach is effective.
CULLING
Culling is really another word for selection. However, it is used to describe the removal of inferior animals rather than the more positive selection of good ones. Thus selection and culling go together.
It is most important to understand whether the decision to cull has been made for genetic or environmental reasons. It is very easy to cull 'poor looking' stock but genetically this achieves little if they were poor because of environmental reasons. The risks of making this type of error seem to be highest when animals are examined after a period of high production such as a lactation.
For example, ewes that have suckled twins are thin and poor-looking while barren ewes are fat. The same would apply to sows that had suckled large litters compared to those that had small litters. It is perhaps understandable that good stockmen like to cull poor looking animals as these tend to reflect on their husbandry skills, but it is important that they appreciate the genetic implications of their actions which may not necessarily be beneficial.
Selection and culling can be visualised as 'pressures' that can be increased or relaxed so that their effects depend on the intensity or strength of the pressure. What selection and culling are doing is altering gene frequency.
Genetic progress -what controls it?
The three factors that control genetic gain in a trait are:
(a) Heritabilty
(b) The selection differential
(c) The generation interval
HERITABILITY
This is the term used to describe the strength of inheritance of a character, i.e. whether it is likely to be passed on to the next generation or not. A precise definition would be - for a given trait heritability is the amount of the superiority of the parents above their contemporaries which on average is passed on to the offspring. Note these key words in the definition where care is needed:
- 'superiority of the parents'
- 'above the contemporaries'
- 'on average passed on'
Heritability is not how much of the measured trait that will appear in the next generation.
The notation h2 is given to heritability and is expressed on a scale from 0 to 1.0, or 0 to 100%. It is often necessary to use generalisations such as these:
Low or weak: 0-0.1 (0-10%)
Medium or intermediate: 0.1- 0.3 (10-30%)
High or strong: 0.3 or above (30% or above)
Where low becomes medium, and medium becomes high is open to debate - it often depends a lot on the character under discussion and the way one wishes to argue a point. To describewhat heritability is, the notation of Professor Lush is used (Ref 9).
The basic equation is this:
P = G + E The part in the box is caused by an association that might occur between genetic variation and the environment and the interaction between them.
The (G) and (E) parts can be divided further. First the (G) has three components:Then (E) has two components:The additive genetic effects (AG) are the most important part as they are stable and are regularly passed on from one generation to the next. Dominance and epistasis are not passed on with the same guarantee.
The environmental part has a special section - the common environmental effect (Ec) which is experienced by members of the same litter as they were all together from conception to weaning and, having some environment in common, are therefore less variable.
The main point to note about heritability is that it is a ratio and not an absolute value. Because of this, estimates can vary greatly depending on how they are calculated and where the data that were used came from. The number of animals used is also important as the more animals there are the more reliable the estimate becomes. The values below show some heritability estimates for different traits in farm animals. Note the wide range in values usually found for each trait.
Heritability can be measured in a number of ways:
(i) FROM THE RELATIONSHIP BETWEEN PARENTS AND OFFSPRING
Comparisons of the performance of daughters and their dams can be used in cattle and in sheep. A disadvantage of this method is that the dams are nearly always a selected (and hence a biased) group, even if the daughters were not selected. Maternal (mothering) effects may also confuse the situation.
Comparisons can also be made from the relationships between halfsibs . (Sibs or siblings are offspring of the same parents.) Paternal halfsibs are all the offspring by one sire out of different dams i.e. a progeny group, and are most often used to calculate heritability. Maternal halfsibs are progeny from one dam by different sires and are more difficult to obtain except in poultry, pigs or by superovulation of large farm animals.
Good estimates of heritability are obtained where there are plenty of sires being compared, each with reasonable numbers of progeny. Minimal numbers would be at least four to five sires with ten progeny per sire, depending on the trait concerned.
(ii) FROM THE ACTUAL RESPONSE TO SELECTION
In some selection experiments where there had been an upward and a downward selection line starting off from a common base, heritability can be calculated from the amount of divergence between the lines. This is not a commonly-used method in farm animals.
(iii) FROM COMPARISONS USING TWINS
Here monozygous twins (one-egg or identical twins) are compared with dizygous (two-egg or nonidentical twins). The differences between the performance of identical twins are all environmental. Twins cannot be compared with singles for this study due to the common environment that affects twin pairs.
Heritability estimates from twin studies are much higher than from non-twin work. An example is the heritability for milk yield which from field data ranges from 0.20 to 0.39. From twin data the estimates are 0.75 to 0.90.
THE SELECTION DIFFERENTIAL
This a measure of how good the parents chosen to produce the next generation will be. It is the superiority of the selected parents over the mean of the population from which they came. It is an expression of the breeder's aim for a trait. The selection differential can be affected by a number of things on the farm.
In a sheep flock for example, if fertility is low and lamb survival poor, and if ewes are drafted (culled) after four lamb crops, then the scope for achieving very superior parents with a high selection differential is very limited. The selection differential can also be reduced if the population is uniform as few animals are far enough above or below the mean to make any impact by selecting the best and culling the worst.
It is important to note that a selection differential can be calculated for both parents - the future sires and the future dams. For some I characters like milk yield, the sire's selection differential can only be calculated indirectly from the mean of his offspring. As fewer males are generally needed than females, then a greater selection differential can be applied to them than to females.
In some flocks or herds, if performance is low, every available female replacement is required to keep up the numbers so no selection is possible at all as seen, say, in British flocks from the very hard mountain conditions. In this case all the responsibility for genetic gain remains with the sires that were chosen. An example of calculating selection differentials is shown in fig. 17 using gain per day in a herd of beef cattle.
To calculate selection differential for MALES:
Gain/ day
Mean of selected males 2.00kg/day
Overall herd mean 0.25 kg/day
Selection differential (2.00-0.25) = 1.75 kg/day
To calculate selection differential for FEMALES:
Mean of selected females 0.75 kg/ day
Overall herd mean 0.25 kg/day
Selection differential (0.75-0.25) = 0.50 kg/ day
AVERAGE
These two selection differentials are then averaged to give:
1.75 (for males) + 0.50 (for females) = 2.25/2 = 1.13 kg/day.
Note what happens when there is no selection of females i.e. where the selection differential equals 0.
The calculation then is:
1.75 (for males) + 0 (for females) = 1.75/2 = 0.88 kg/ day.
Clearly the potential genetic gain has been severely reduced from 1.13 kg/day to 0.88 kg/day.
The key to success in obtaining a high selection differential is to have plenty of variation to start with, and many more animals than those needed to maintain the flock or herd size so that only the very best can be chosen as parents for the next generation.
Selection intensity
It is possible to calculate the actual 'intensity' of selection using this formula:
Intensity (i) = Selection differential/Phenotypic standard deviation
The phenotypic standard deviation (the standard deviation of the animal's phenotype) is simply a way of describing the variation normally found in the trait for a particular population. The table below gives some examples for different livestock.


The most important aspect to affect the practical breeder is how the number of animals available to choose from governs the progress that can be made. This can be most easily shown in a sheep flock with different levels of fertility shown in table 5 for ewes.
 Note that as the fertility increases then the number of animals available for selection increases. As the number needed for replacement is constant, then the percentage selected decreases and the percentage culled increases. The values for intensity can be read from the curves presented in fig. 18. The intensity clearly increases with increased lambing percentage. Using 80% lambing as a base of 100, the intensity for 180% lambing is 219. (Redrawn from Falconer, Ref l6.)
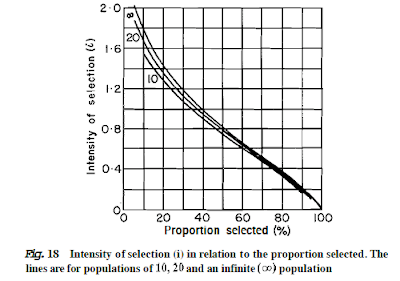
THE GENERATION INTERVAL
This is the time-interval between generations and is defined as the average age of the parents when their offspring are born. Obviously it varies greatly between species and particular breeding plans but some general average values, in years, are as follows:
To ensure rapid progress the aim is to keep the generation interval short. This, however, is partly limited by puberty (sexual maturity) which is the youngest age at which an animal can be bred. The generation interval can also be severely restricted by how long the breeder has to wait until sufficient data are available from an animal on which to make a decision. An example of this is waiting for completed first-lactation milk yields of daughters before a bull is widely used in a herd or through the national herd by artificial insemination.
GENETIC GAIN
The way in which the three components (heritability, selection differential and generation interval) are put together to give an estimate of genetic gain is as follows:

The equation for gain for year is the core of a breeder's programme and dictates what he gets out of it - see figure 19.

Fig. 19 shows the formula for gain per year in the form of a balance. Ideally, maximum gain is obtained from high heritability, large selection differentials and short generation interval. A typical situation in practice is where breeders have to work on traits with low heritability (e.g. reproduction) and they have long generation intervals caused by waiting for information from offspring. The only possible solution then is to achieve a very high selection differential to counter-balance the other two components.
The formula for gain per year can also be written in full as follows:
In previous discussions about genetic gain and its components, the assumption has been made that only one trait was being considered. So it is not difficult to see how progress will be reduced if the breeder considers large numbers of characters.
Measuring genetic improvement
This is a very important issue because it is the justification or proof that all the effort put into a breeding programme has been worthwhile. Unfortunately it is difficult mainly because genetic improvement often cannot be clearly separated from environmental improvements. To do this certain standard techniques can be used as follows:
(a) CONTROLS
These are control flocks, herds or lines specifically set up by the breeder or perhaps a group of breeders, and are bred continously at random as a base or reference. The control populations will reflect only variation caused by the environment, for example seasons, disease outbreaks, changes in staff and so on and provide a genetic constant.
Control populations should be large enough to maintain effective random mating and keep the inbreeding level as low as possible. Thus the number of males and the number of females usedare critical (see Appendix I). A suggested size would be 25-50 males and 50-100 females as a guide.
The main problem in control populations is 'genetic drift' - a type of random change in gene frequency. Any population can change despite efforts to avoid this. One technique to minimise this is to keep re-constituting the control population or run the control at different locations to allow comparisons between them and hence check on drift.
Examples of control populations are:
- Meat and Livestock Commission pig improvement scheme (UK) - 16 boars and 32 gilts
- Cockle Park pig selection (UK) - 16 boars and 32 gilts
- Beltsville pig selection (USA) - 12 boars and 12 gilts
- Scottish Blackface sheep selection (UK) - 10 rams and 250 ewes.
- Cornell poultry selection (USA) - 50 cocks and 250 hens
- Hereford cattle selection (USA) - 25 cows and 1 bull
(b) REPEAT MATINGS
This is where the same parents are used in different years. It is done by usingfrozensemen so that progeny can be produced by thesame sire (i.e. progeny of the same breeding value) but are born in different years.
The difference between the progeny is due to environment, and the difference between the rest of the flock or herd and the repeated progeny is genetic gain. This may be done by using semen from a random group of sires and using it after 2-, 5- and 10-year intervals. It is a technique that is at present easier to apply in cattle than in pigs and sheep because of semen freezing problems and fertility levels.
Selection limits
In farm animals where most of the important traits are polygenic, there is little likelihood that breeders will run out of genetic variation. The limits to selection have been studied mainly in laboratory animals (insects and mice) and poultry. What happens in selection lines is that there is usually a response to selection for a while and then it slows down and eventually stops. The observed record of progress shows a definite 'plateau' as drawn for a hypothetical situation in figs. 20 and 21.

The plateau is usually caused by the population running out of usable genetic variation (fig. 20). However, if some new variation is introduced,. progress from selection continues until the population reaches another plateau and so on (fig. 21).
There are a number of ways in which breeders can introduce new genetic variation into their selected populations. Examples are by crossbreeding or by inducing mutations either naturally or artificially. In future there is even the possibility of synthesising new variation from basic chemical components through genetic engineering.
PRESERVATION OF GENETIC VARIATION
Recently there has been a renewed interest in the preservation of genetic variation in farm livestock. This has come mainly through the desire of breeders and geneticists to store genes or 'germ plasm' (USA terminology) of the minority breeds, some of which were on the verge of extinction.
The first task has been to catalogue these breeds, and this has been started by the Food and Agriculture Organisation (FAO). Germplasm can be stored as semen for some species (the haploid state) or fertilised ova (the diploid state). In some countries the last remaining animals of a breed have been kept in zoos or game parks, and although inbreeding can cause problems in small groups of animals and stocks can be difficult to maintain through lack of fitness, there are still examples in several countries of small groups of animals being maintained successfully.
Breeding Value and the aids to selection
It was stated earlier that selection was the business of making decisions about animals in the light of 'information'. It is here that breeders have to start and consider the 'Breeding Value' (BV) of an animal.
This is really its genetic worth and is what animal breeding is all about. Unfortunately, although this concept of Breeding Value has been developed for a long time, it has not been widely used in practice in all areas of farm animal improvement. Perhaps the dairy industry has used it most.
To help make decisions, there is a number of well-recognised sources from which the required information can be obtained. These are referred to in the recognised texts as 'aids to selection' and are asfollows:
(a) Individual or mass selection
(b) Lifetime performance records
(c) Pedigree information
(d) Progeny performance
(e) Performance of other relatives (family selection)
INDIVIDUAL OR MASS SELECTION (PERFORMANCE TESTING)
This is used when the animal's own performance is a measure of its genetic merit.
This aid to selection is used for traits of high heritability where the animal's own performance is an accurate guide as to how its progeny will breed. The comparison of animals based on their own individual performance is usually called a 'performance test'. This term is not used so much in dairy cattle but is regularly applied to beef cattle, pigs and sheep.
The theory behind it is simple. Here the best individuals selected from within a group of animals of similar age that have been similarly treated (they are contemporaries). Some practical problems may arise over what is meant by 'similarly treated' and most concern is usually over the treatment before the animals went on test (the pre-test environment). This is an important aspect and is discussed later. The point to remember is that animals should be compared within environments and not between environments whenever possible.
The real test of the value and accuracy of a performance test is whether the results (e.g. the merit-order of the animals tested, usually males) agree with the results from a subsequent progeny test (discussed later). In selecting the best individuals the breeder has a single record of each animal's performance (the performance test), and hence an estimate of the Breeding Value (BV) for a given trait is calculated as:

LIFETIME PERFORMANCE RECORDS
Here the breeder has more than one record of an animal's performance, such as a series of lactation yields in a cow, annual fleece weights in a ewe, or repeated litter performances of a sow.
A good animal (genetically) will generally perform well each season and this will be seen in above-average merit despite the ups and downs in the flock or herd average each year due to environment. The superior dairy cow, for example, will have above-average yield despite the poor quality bulk feed produced due to poor weather, whether milked by trainee or experienced staff and no matter how she is housed.
If a breeder looked at one of the cow's past records he could make a fairly safe prediction about her future records. This then is the concept of 'repeatability' which is the tendency for the performance in the same animal to be similarly 'repeated. The greatest value of good (or high) repeatability is as a time saver; the breeder can make a decision early in the animal's life and predict correctly what would happen over its lifetime.
Repeatability in statistical terms is the correlation between records. Repeatability and heritability are often confused. In simple terms repeatability tells how an animal will repeat a trait during its lifetime, whereas heritability tells how it will pass it on to the next generation. Repeatability, like heritability, is on the scale of 0 to 1.0 or 0 to 100%. Table 6 gives some general estimates of repeatability for traits in farm animals.
Table 6. Repeatability estimates
Lifetime records are extremely valuable, as animals that have produced well over a long life have proved that they may have the genetic ability to survive and then perform in their environment. They have the 'wear-and-tear' qualities so important economically in practice.
Note, however, that waiting for completed lifetime records on an animal before wide exploitation will increase the generation interval, even if it increases heritability, and hence overall genetic progress will be retarded. The breeder now has to use these repeated records to build up a Breeding Value.
Here the BV is obtained by multiplying the animal's average deviation by a formula (sometimes called a confidence factor). Note that the animal's average deviation is obtained by- taking the deviation form the mean of each record and then averaging all deviations. The confidence factor formula is :

In a beef herd selecting for weaning weight, the dams are assessed on the age-corrected weaning weight of all the calves they have produced.
Assume heritability = 0.3
Assume repeatability = 0.45
Using the confidence factor formula, a series of values can be worked out like this:

Thus, the more records, then the greater can the confidence be in them. This can now be built into the BV calculation using three cows A, B and C.

At this stage, the order of merit in these cows would be B, C, then A. However, the interesting questions are how will A do with some more records and will cow C really improve with her next calf.
Remembering that repeatability is fairly good (0.45), it would be reasonable toassume that A would never catch up unless you knew she had suffered some environmental tragedy that was not her genetic fault (e.g. if the calf was injured and could not suckle).
Cow C likewise looks as if she is going to carry on being above average in BV but is not an outstanding cow. These comments perhaps illustrate that the Breeding Values are 'predictions' of the genetic worth of the animal and the term 'predicted breeding value' is often used.
It is here that an appreciation of the difference between permanent and temporary environmental effects is important. For example, a dairy cow losing a teat by accident is a permanent effect, but a temporary effect occurs when a cow calves late or out of season and hence is temporarily penalised.
This is why heritability appears to increase as the number of records increases - the temporary environmental variation is reduced. Note that averaging several records is of greatest advantage when repeatabilities are low.
PEDIGREE INFORMATIONA pedigree is simply a record of ancestry and most problems in practice arise over what value this record is. If, for example, it is only an officially-registered name and number by a breed association, then it can be of very limited value.
If on the other hand it is complete with performance data as well as the pedigree names, then it is very useful. It must be remembered that, when pedigrees were written down by the first improvers, an animal's name was all that was necessary as everyone knew how it performed.
This may still be the situation in the sheep-dog world where the names of certain dogs are internationally famous because they have won many world-recognised trials.
A British breeder of sheep and beef cattle, Mr 0scar. H. Colburn, has stressed that master breeders still use the technique of memorising in detail the pedigrees and physical characteristics of ancestors, and use the information to predict those that would transmit important traits to future generations. 'Master breeders' could be defined as successful pedigree breeders, but as Mr Colburn pointed out there are also breeders who use the same techniques but are not successful.
There is also the problem that many important traits in farm animals, such as qualities of sheep dogs, draught horses and so on, cannot readily be measured to put in a 'performance pedigree' so it is easiest merely to record how many show prizes they have won.
The bases of the pedigrees are 'relationships' and these are classed as either (a) direct or (b) collateral i.e. descended from the same ancestor. The main concern of the breeder in using pedigrees is to decide how much consideration or weight to. give to each ancestor because if he is
using an.extended or fully written-out pedigree it will show very many ancestors; The points to remember in a pedigree (fig. 22) are these:

- The animal whose parentage is recorded is called the 'subject' of the pedigree.
- Each animal in the pedigree gets half its genetic make-up from its parents - no matter at what stage in the pedigree this is examined.
- Grandparents each contribute one quarter of the genetic make-up of the subject, but the contribution made by an earlier ancestor will be even smaller. For example, an animal may have an outstanding great-grandparent, whose contribution will be one-eighth, but it must be remembered that seven-eighths come from all the others, who could have been doubtful performers.
- The accuracy of the ancestors' performance, if known, may not behighly reliable because they have been recorded under different environmental conditions.
There are still some unfounded beliefs associated with pedigree breeding. Some pedigree thoroughbred race-horse breeders and trainers believe that a much greater genetic contribution comes from the dam's side than the sire's side.
Also some dog breeders believe that a sire contributes size to his offspring and the dam contributes colour. There was also the unfounded confusion expressed by Galton's first 'Law' inwhich he proposed a 'blended inheritance' where all the ancestors'contributions were blended to make up a total of 1.0 instead of adding up to 1.0 in each generation. According to Galton

This 'Law' has been disproved, however. It is not accepted nowadays and should be ignored.
The business of naming animals tends to perpetuate misunderstandings over pedigrees. Breeders may use a basic name - perhaps the name they gave to their first foundation female such as 'Buttercup', a cow, or 'Belinda', a sow. Then all the subsequent offspring that Buttercup or Belinda have, regardless of the number of different sires they are mated to over their lifetime, are called Buttercup 1st, 2nd,. . .up to 105th and so on.
The same happens with Belinda so these become the Buttercup and Belinda families based entirely on the female line. The term 'blood line' may also be used instead of family. This can be very confusing if not clearly defined (see later discussion of family selection).
For traits of high heritability little is gained from considering ancestors and most progress can be made by evaluating the animal itself. Generally, collaterals (half-sibs or full sibs) provide more accurate data than do ancestors. Note that using ancestors is like progeny testing in reverse and presents the hazard that the breeder inevitably has to look at selected ancestors and not an unbiased random sample. Professor Lush (Ref 9) summed up the emphasis given to an ancestor as depending on:
- How close is the relationship between an ancestor and the subject of the pedigree.
- How accurate are the data on the intervening ancestors if they are known.
- The heritability of the trait.
- The environmental association (correlation) between the ancestor and the subject, and between different ancestors.
The main danger in pedigree selection is that the harm done by lowering the intensity of individual selection is greater than the good done by making the selection more accurate. Note especially that rarely do pedigrees record the presence of recessive genes or defective animals
- these animals are simply not registered. It must be appreciated that breed associations value an official pedigree as a guarantee of breed purity.
The Breeding Value concept can be used with pedigrees where the principle is to predict a BV for the subject animal in the pedigreeand this is done by a statistical technique of using a regression equation. Here:

Again it is obvious that as the number of records increases then so does the confidence in them. Thus for a dam with three lambing records and an average deviation of 0.2 lamb above her contemporaries (corrected for age, birth rank, age of dam and run in the same environment), the
BV of her son would be: BV(son) = 0.12 x 0.2 lamb = 0.024 lamb.
Note that the confidence factor formula is half that used for predicting a dam's own BV from the average of her records (see later) because a dam only passes on half of her genes to her offspring. If the grandam has records, they can be used as can those of the great-grandams
but their confidence factors are reduced by half. In table 8, they are presented along with the dam's factors from table 7.

Clearly, it is not worth going back in the pedigree beyond the grandam no matter how many records there may be on the great-grandam. This development of Breeding Values can then proceed to build into them the dam's information plus both the paternal and the maternal
grandam's information. See Turner and Young( Ref 17) for these formulae and further discussion.
PROGENY PERFORMANCE (PROGENY TESTING)Basing decisions on the performance of an animal's progeny is called progeny testing. It is a technique generally used for males because they are responsible for more progeny in their lifetime than any one female.
Progeny testing is used in these situations:
- For weakly inherited traits
- For traits expressed in one sex (e.g. milk production)
- For traits expressed after slaughter (e.g. carcass composition).
The genetic principle behind progeny testing is simple. As each offspring represents a sample of the genes of each parent (drawn at random), then the more samples that are examined the more accurate the assessment of the parents.
Calculation of how many offspring are needed to show a real difference (and not a chance one) between sires is important for both genetic and economic reasons. Progeny testing takes time and the keeping of progeny groups for long periods can be an
expensive operation.
The main points concerned with getting the best results from progeny testing are these:
- Test as many sires as possible (5 to 10 would be minimal).
- Make sure the dams are all randomised to each sire, within age groups if possible (see page 135 for details).
- Produce as many progeny per sire asis possible(aim for at least 10-1 5 of either sex per sire for growth traits but up to300-400 offspring may be needed for traits like calving difficulty and fertility).
- No progeny should be culled until the end of the test.
PERFORMANCE OF OTHER RELATIVES (FAMILY SELECTION)The term 'family selection' is generally applied to situations where relatives are used to help make decisions. In practice there is generally a great deal of confusion over family selection because breeders use different definitions of the term 'family'. The whole business of'families
and blood lines' is part of the tradition of pedigree breeding.
Families can be broadly classified into three types:
(i) SIRE FAMILIESThese are progeny of one sire:
- Out of different dams - born in the same year (contemporaries).
- Out of different dams - born over a number of years.
(ii) DAM FAMILIESThese are progeny of one dam:
- By different sires - born in the same year as can be done by superovulation of the dam before artificial insemination with mixed semen from a number of sires. The progeny may be identified to sire by blood typing.
- By different sires - born over a number of years.
(iii) SIRE AND DAM FAMILIESThese are progeny by one sire out of one dam. Again by ovum transfer a number of offspring can be obtained as contemporaries born in the same year, or offspring can be obtained over a number of years.
It is obvious how the carrying on offamily names in pedigrees(discussed earlier) adds to the confusion. Professor Falconer's explanation(Ref 16) of family selection is presented in fig. 23 where he used hypothetical families.
Here there are four systems of family selection A, B, C and D. In each system there are 25 individuals divided into five families (five per family). The mean of each family is marked by a cross. A, B and C are identical arrangements and ten animals have to be selected from each
system shown by solid circles.

A. This is
individual selection - the best ten individuals are kept regardless of the family means. Note that none were kept from family 3, only one was kept from family 4 and four were kept from family 5.
B. This is between-family selection where only the animals from the best families (2 and 5 with highest means) are kept.C. This is within-family selection where the best animals from each
family are selected.
D. This is a situation where within-family selection is most useful i.e. where differences between family means are large and the variation I within families is small.
It is important to note the difference between the within-family and the between-family methods of selection. If you select within a family then every family is represented in the next generation. If you select between families, then only some families are represented and there could be a
rapid build-up in the rate of inbreeding.
Genetic theory stresses that family selection is most effective when the genetic relationship between members of the same family is large, and the observed (phenotypic) relationship between members is small.
This is a situation found in families produced after inbreeding(inbred lines). The breeder's problem is to make a decision based on the animal's own traits, its deviation from the family average and how good that particular animal is compared to others - provided he knows how the family was defined.
COMBINATIONS OF SELECTION AIDSBreeders often use combinations of these various selection aids and most common would be the combined use of individual and family selection, the decision depending mainly on the size of the heritability of the traits. Where heritability is low the use of family data is most valuable as it reduces the chances of making the wrong decisions. Family selection and progeny testing are different aspects of the same thing.
SELECTION METHODSOnce the breeder has decided on the information he is going to use to aid his selection then he actually has to do the selection. There are three methods of selection; tandem selection, independent culling levels and index selection.
(i) TANDEM SELECTIONThis is where the breeder selects for and improves one character until it reaches an acceptable level, and then he leaves it while he selects for another and so on for a third. This is illustrated in fig.24.

Note that trait A was improved quickly in one generation whereas B took more time (two generations) and C took very much longer to improve (four generations). Note also that this is a situation where A remained stable when he worked on B, and both A and B remained where they were when he worked on C.
In other words the traits are assumed to be independent. If they were not, then the situation could be as seen by the dotted line A where as B went up A came down, i.e. a 'see-saw effect' caused by a genetic antagonism between them.
This is the business of the genetic correlation discussed later. This is probably the most commonly used technique in practice. It is seen regularly where for example a dairy breeder buys a bull to bring up the fat level in his herd for a while, then uses sires noted for yield; a pig breeder buys a boar to increase length then he will continue selection for growth; a sheep breeder aims to select for fertility but as the wool price rises he goes for fleece weight.
If wool prices collapse and lamb prices improve he will swing to sires with good weaning and hogget weights. It seems to be a 'stop-go' policy but often meets the needs in rapidly changing economic conditions.
(ii) INDEPENDENT CULLING LEVELSHere accepted levels of performance are set and any performance that fails to reach these levels means automatic culling. It is like an examination system with different pass marks for each subject but if the student fails one subject then he fails the lot.
There is no compensation for poor performance in one trait by brilliance in another. This method is most useful when traits are reduced to a minimum and where culling is done at different stages in an animal's life.
Some examples in sheep would be:
- The variation seen in each trait - the phenotypic standard deviation.
- The heritability of the traits.
- The phenotypic relationships (correlations) between the traits.
- The genetic relationships (correlations) between the traits.
- The Relative Economic Value (REV) of the traits.
The REV often causes confusion among users of an index because it is not based on the actual prices in use at one particular time, but rather the relationship between the prices of the components over a period of time. Thus the relation between prices in the past is used to predict their relationship in the future.
The aim in computing an index is to derive an estimate in which the various traits are appropriately weighted to give the best prediction of the animal's breeding value i.e. what it will produce when it breeds. An important aspect of an index is that if one component is missing then benefit can be obtained by predicting the missing one from the others that are present.
So basically it is a large weighting exercise that in the past has been beyond the means of practical farmers, but with the rapid increase in the use of computers there is no reason why future breeders could not use index selection more extensively - even if it was to modify generalised indexes to suit their individual circumstances.
It is important to ensure, however, that the technical sophistication achieved is economically rewarding. It often seems that the main problem with a selection index is that scientists cannot explain to breeders how it works. Some breeders have developed their own 'home-spun' indexes in an attempt to grasp some of the benefits but avoid the complexity.
However, care is needed with indexes to find out how they were calculated before they are accepted. In a selection index used for sheep (New Zealand National Flock Recording Scheme, Sheeplan), the main features are shown in a simplified table (table 9).
Column (1) is a predicted average genetic gain in the four characters while column (2) is the relative economic value among the traits.
Note that NLB is very important followed by wool production (HFW). Body weight (HLW) is taken as zero as bigger animals eat more so the net economic gain will be zero.

Table 9 calculations based on three lambings per dam and a selection differential of one standard deviation.
Column (3) shows the contribution of each trait to economic response by using the index. The author has developed a diagram to try and explain insimple pictorial terms how the index works. This is shown in fig. 25.

Fig. 25 shows the four components of the index drawn as separate sheep, using the abbreviations in table 9.
Heritabilities are drawn on the sheep for each trait as a number on the scale 0 to 100.
The genetic correlations are shown above the sheep and the phenotypic ones below, again as numbers out of 100. The term 'physical links' may be used to describe the phenotypic correlations or 'genetic links' to describe the genetic correlations if correlations are not understood.
These correlations can be added to the picture of the sheep in a series as overlay
transparencies for an overhead projector along with the lines added to show the Relative Economic Value (REV) of the traits in the combined index for a ram.
transparencies for an overhead projector along with the lines added to show the Relative Economic Value (REV) of the traits in the combined index for a ram.
transparencies for an overhead projector along with the lines added to show the Relative Economic Value (REV) of the traits in the combined index for a ram.
The HLW does not contribute directly to the index but is important as an indirect aid to improving NLB through the genetic correlation between HLW and NLB (of 20).
Genetic theory says that an index is predicted to be \/n times as efficient as independent culling levels when n = the number of traits involved. The greater the number of traits involved, the more accurate the index becomes, for example:

Poultry breeders have used indexes with up to 16 items for egg production alone, some traits appearing in the index in various forms such as in individual records and various family averages. Pig breeders have used indexes containing up to 9 traits. Sheep and beef breeders
have been much slower to use index selection but this could change in the future.
RELATIONSHIPS BETWEEN TRAITSBreeders readily recognise that some characters, or aspects of them, affect others. This is part of the whole complex of animals becoming adapted to their environment and the term 'fitness' is often used to describe this.
Breeders are aware for example that increasing milk yield affects a quality such as fat percentage, and increasing live-weight gain may increase carcass fat deposition; or increasing body weight could increase fertility and thus increase mortality at birth. The list of examples could be endless.
Relationships in statistical terms are expressed by corre1ations. These are calculated as values on a scale from -1.0 through0 to+1 .O, and show how one factor (often called a variable) changes as another variable changes.
Positive correlations show that as one trait goes up then so does the other, while negative correlations show that as one trait goes up then the other goes down. It is possible to get some idea of the correlation between two traits by plotting them on a scatter diagram and drawing points where the values for each animal meet.
Fig. 26 shows the types of scatter that are associated with different correlations between some traits in livestock.
Correlations are broadly classified as follows:
-1.0 to -0.6 = high negative
-0.5 to -0.4 = medium negative
-0.3 to -0.2 = low negative
-0.1 to +O. 1 = negligible (zero)
+0.2 to +0.3 = low positive
+0.4 to +0.5 = medium positive
+0.6 to +l .O = high positive
For a complete and detailed explanation of correlation and regression, the reader should consult books on biometry and statistics (Refs l8 and 19)
 Fig 26. Different types of relationships (correlations) between traits.
TRADITIONAL RELATIONSHIPS BETWEEN TRAITS
Breeders work amidst an enormous legacy of belief that has been passed down as part of traditional teaching. This is guaranteed to generate heated discussion between scientists (who tend to disbelieve) and breeders (who tend to be believers). Here are some examples:
- Flat bone denotes good meat potential.
- Certain coloured fibres in a sheep's fleece denote hardiness (e.g. red kemp in Welsh Mountain sheep).
- Good milk veins on a cow's belly denote high milk yield.
- A thin skin (when pinched between finger and thumb) denotes good milk potential in a dairy cow.
- Good heart-girth in a cow denotes good constitution (an ability to thrive and withstand stress).
The list could be endless. Some of the relationships are physiological nonsense and must be ignored, but there could be some truth in others so care is needed until concrete evidence is available. It is interesting to note that some of these firmly-held beliefs may be specific to a breed, a district or a country, and may be almost part of the social culture.
It is easy to understand how these relationships developed because for important traits like thrift, constitution, intelligence that were difficult to measure, the breeders had to find some easy-to-see trait as an indication of merit to be able to make a decision at all. Generally no harm would be seen to be done and faith in, and respect for the'master breeder' who propounded it probably gave the relationship a sort of blessing. So despite our sophisticated modern age, breeders still have these traditional beliefs -and the disagreements between scientists and breeders look as if they will continue for a long time yet.
DIFFERENT TYPES OF CORRELATIONSIn animal breeding it is important to recognise three different correlations and to describe them we need to go back to the basic equation of:

This shows that there are correlations between the phenotypes, the genotypes, and the environments of these two traits in the animal. The above equations highlight the fact that if the two traits appear to be related (i.e. there is a phenotypic correlation between them), then this
could be for two reasons:
(a) Some of the genes affecting one trait also affect the other i.e. the genetic correlation between X(G) and Y(G). This is pleiotropy, discussed earlier.
(b) Some non-genetic or environmental factors affecting one trait also affect the other, i.e. the environmental correlation between X(E) and Y(E). An example would be in a starved flock of ewes where all those that bore twins would have finer wool. This is called 'hunger fine' wool as the ewe does not have enough feed energy to divert to wool and reproduction has higher priority. Clearly this is an environmental problem and not a genetic relationship between fine wool and twinning.
Genetic correlations are of greatest interest to breeders for three main reasons:
(i) They can indicate how things are likely to change in the next generation. Thus selecting, say, for growth rate in this generation by picking the heaviest bulls at 400 days of age, the birth weight of their calves (the next generation) will also increase and could result
in calving difficulty.
(ii) They can be used to plan counter-selection measures to prevent any correlated changes that are not wanted. Thus in the above example where birth weights were increased by increasing 400-day weight, the breeder should look for individual sires (by progeny testing) whose calves were produced without difficulty despite their being heavier at birth.
(iii) They can be used in situations where one trait may be difficult to improve and another correlated trait can be used to help improve it. The 'difficult' trait may be difficult because of practical problems in measuring it accurately or because it has low heritability. An example would be where a pig breeder wanted to improve feed efficiency but did not want to record the feed eaten. He would simply select for gain and would know, from the good genetic correlation (negative), that as gain increased feed conversion became better, i.e. less kg feed/ kg gain.
Another example, in sheep, would be that as fertility has low heritability, direct selection would bring slow improvement. This could be assisted by selecting for yearling body weight that is both phenotypically and genetically correlated with fertility (lambs born).
This whole subject is dealt with in the main text booksl6asa study of the correlated response to selection and the relative merits of both direct and indirect selection. A practical view is that the stud breeder should obviously concentrate on the genetic parameters (estimates) like heritability and genetic correlations.
However, commercial breeders who will be concentrating most of their selection on females and will be buying in sires are more concerned with phenotypic selection, and hence are more interested in parameters like repeatability and the phenotypic correlations between traits.
Care is needed with phenotypic correlations between traits until the size and sign of the genetic correlation between them is known. The greatest hazard is where there could be a positive phenotypic correlation masking a negative genetic one, and where real progress would mean going in reverse. Phenotypic and genetic correlations between traits as well as heritabilities are usually presented in tables, and typical examples of these are shown in table 10. The genetic correlations are shown above the diagonal, with the phenotypic ones below.

Breeding and the environmentThis is a very important part of the study of applied animal breeding and a great deal has been written about it over the years by scientists and breeders alike. Despite this there still seems to remain some confusion. The confusion seems to arise through a misunderstanding of the effect
that the environment has on the animal (the phenotype), and the effect it has on its genes (the genotype).
The environment can have a direct effect on the phenotype, for example, through nutrition, disease incidence and management, but can have no effect on the genotype. The genotype can only be indirectly affected by the environment by the alteration of gene frequency so that certain types are selected as parents for the next generation and others are ignored.
The problems that concern breeders can be best expressed as a series of questions that are regularly asked on this subject. Examples are these:
- Will the 'hardiness' of sheep for mountain and hill conditions be adversely affected if ram-breeding flocks that supply them are located on good lowland conditions?
- Will selection of beef bulls by performance testing for growth under intensive concentrate-fed conditions also identify sires whose progeny will grow well at pasture?
- Will selection for high egg production in poultry kept in cagesproduce birds that will lay well on deep litter or free range?
- Will pigs selected for growth and carcass merit on wet feeding regimes produce progeny who are also superior on dry feeding regimes?
- Will progeny testing of dairy bulls for high milk yield using progeny fed at pasture and milked in large herds in rotary cow-sheds, also produce progeny that do well when milked in cowsheds in small herds under intensive feeding conditions?
- Will selection for growth rate in cattle in temperate climates produce offspring that perform well in the tropics?
The questions are limitless and complex and the whole subject is really concerned with what is called genotype-environment interaction or G x E. The question is to see whether a genotype responds differently (interacts) indifferent environments.
A hypothetical example would be where two cattle breeds were tested for good growth rate in two contrasting environments like this:

Here the Hereford has failed to perform in the tropics (because of heat stress) whereas the Brahman has grown well in both environments.
To try and answer some of these questions that concern breeders, geneticists have worked mainly with laboratory animals to try and elucidate the basic principles. The general simplified conclusion from a great deal of work is that for genetic reasons it is best to select and breed animals in the environments in which they have to perform. This is also the easiest thing to do for practical reasons as the breeder does not have to worry about selecting for things in one environment that are needed in another.
However, it is important to stress the need both to select and to breed in the same environment. It is when these are split that problems can arise. This would happen where a flock breeding rams for the mountain is kept entirely on the lowland, with no ewes ever coming down from the mountain to supplement the ram-breeding flock.
In the previous questions, for example in the bull performance test, difficulties could only arise if selection on feedlot produced stock that could not walk and hence graze pasture themselves.
Similarly, in poultry, if selection in cages altered the bird's physiology or behaviour so that it could not lay on litter or at range, then there would be serious problems.
The greatest concern for breeders is where there are many genotypes (e.g. breeds) to test and many environments. Among all the possible combinations of breeds and environments there are usually some important interactions. In general, research results would show up to the present that G x E is not very important in dairy and beef cattle and is more important in sheep, pigs and poultry.
Although it may appear that poultry are kept in controlled environments, there are still important variables like the number of birds per cage, stocking intensity, cages versus litter, feeding, lighting and temperature regimes, exposure to certain diseases and so on, any of which could interact with specific genotypes. It is obvious that breeders have to cover themselves against the most important variables, although they cannot cover all the hazards of commercial environments.
This subject becomes of special interest when the needs of breeders around the world are considered. With the current ease of transferring genotypes by semen or embryos, the responsibilities of breeders are greater, especially if minority breeds in one area become internationally popular.
An example would be the world popularity of Charolais cattle, which were bred in small herds in France, but whose progeny are now performing on sugar by-products in Cuba and Brazil, on dry pastures in the Australian outback, on steep hill country in New Zealand and under heat stress in Fiji. Breeders in each country will eventually develop their own strains but breeders returned to France in the initial stages for new blood lines. The French breeders thus had a big genetic responsibility which could have involved consideration of G x E interaction on a world basis.
MATERNAL ENVIRONMENTBreeders are very much concerned with the effects of the maternal environment - sometimes referred to as the 'maternal handicap'. This is the environment that a mother provides for her offspring from conception to birth and then up to weaning. It affects the offspring's phenotype and not its genotype.
The genotype of an animal cannot be affected in this way as was formerly believed in the theory of telegony. This was a belief that the effects of previous pregnancies could affect later ones, for example when a pedigree bitch was mated to a mongrel dog it was thought that this would affect subsequent litters by pedigree dogs. This theory, however, has been proved false.
Another erroneous belief was that the physical environment of the dam could affect its offspring's genotype, for example schooling a mare during pregnancy would increase the chances of the foal being a good jumper. This is also unacceptable.
It is most important to be aware of situations where improved performance in an offspring may appear to be due to superior genotype but is in fact caused by the maternal environment. This is usually seen in cross-breeding as in the classical example of the large Shire crossed with the small Shetland horse.
The F1 offspring out of the Shire mare (by the Shetland stallion) were three times heavier at birth and one and a half times heavier at four years old than the offspring out of the Shetland mare (by the Shire stallion). Similar work was repeated with the large South Devon and the small Dexter breeds of cattle (Ref 3).
The problem of maternal environment is especially important where litters of offspring are involved. Here litter sizeand hence competition in utero before birth can limit subsequent genetic expression of growth traits. (See Learner and Donald (Ref 1) for further discussion.
Breeding methodsSo far, the discussion has concerned how the breeder selectsparentsfor the next generation. His next task is to decide how to breed them, i.e. how to mate them together. This is the area of 'breeding methods' and is classified in table 11 where the methods are first divided broadly into closebreeding which is the mating of related parents, and outbreeding which is the mating of unrelated parents.

INBREEDINGInbreeding is the mating of animals that are moreclosely related to each other than the average of the population i.e. mating animals that have one or more ancestors in common. So the key to searching a pedigree for evidence of inbreeding is to look for those 'common ancestors' that appear on both sides of the pedigree.
If the parents of an animal (the subject of the pedigree) have common ancestors close up in the pedigree, then the offspring will be inbred and this degree of inbreeding can be calculated and expressed as the 'inbreeding coefficient'.
The level of inbreeding thus depends on the closeness of the relationship between the parents. Either or both parents may be inbred themselves, but if they are not related to each other then the subject cannot be inbred.
The 'inbreeding coefficient' is the rate at which heterozygosity is reduced (or homozygosity is increased) per generation in the population. The calculation of an inbreeding coefficient is described in Appendix I.
Inbreeding simply reduces the number of gene pairs that are heterozygous in the population and increases the proportion of gene pairs that are homozygous, regardless of whether they are good or bad. The main value of inbreeding is to concentrate genes in the population and to retain known merit by following a particular animal with one of its close relatives.
Inbreeding is often used because of necessity rather than choice, especially by 'top' breeders whose stock have reached a high level of performance. They may need a new senior stud sireand cannot find one in anyone else's herd that is as good or better than their own. Insuch a situation the best possibility would be a relative, perhaps a half brother or son of the sire they are using.
INBREEDING FEARSNo other aspect of animal breeding seems to have as much fear and mystery built around it as inbreeding. It seems as though some of this fear has come from human genetics and religions with the fear of increasing consanguinity (the same blood relationship).
The fears of inbreeding in animals are about 'inbreeding depression' which results in a reduced performance or fitness of the animal for its job. Some traits are affected more than others. Initially inbreeding may throw up odd defects such as undershot jaw, dwarfism, odd colours and so on, but these are usually of limited economic significance in the early stages and are basically recessive genes being thrown up.
They can usually be reduced in a reasonable-sized flock or herd by culling the carriers, especially the males, if the breeder cannot afford to cull the female carriers. It would then certainly pay to go to a completely unrelated sire that was guaranteed free from the defect but these may not always be easy to find. Known 'carriers' of these defects can be used to mate with other animals for testing.
An example of this would be the mating of a bull which was intended for widespread AI use to about 15 to 20 of his own daughters. If there were any recessive genetic defects in the stock then they should appear in these matings. Then the breeder has to assess how important these defects are:. there seems little sense, for example, in slaughtering an outstanding Holstein bull that will improve both milk and fat yield because he throws one red calf in every 10,000 progeny. Somewhere the breeder has to decide what is acceptableand what is not, and this is usually a very difficult decision.
What is termed 'inbreeding depression' can be more serious than throwing up the odd recessive genes. It is the gradual lowering in performance of traits and is seen especially in characters like fertility, survival and size. The breeder may not suspect inbreeding depression
and may waste time searching for the cause of the problem in the environment such as disease, poor feeding, seasonal effects and so on.
Very rapid rises in inbreeding usually bring out the problems (if thereare any) more quickly than a slow build-up. Table 12 shows the different build-up in inbreeding level (expressed as a percentage) with different systems of inbreeding.

The one, three and five sires are new sires chosen each year in a closed flock or herd, so if an average generation interval of five years is assumed, then the breeder needs 5, 15 or 25 new sires used per generation.
Clearly, self fertilisation as used in maize causes very rapid rises in the inbreeding level, as does mating full sibs (half brother to half sister) which is the most intense rate of inbreeding in animals followed by the sire back on the offspring. However, it can be seen that by using relatively few new sires each year, a flock or herd can be closed for a good number of generations before the average inbreeding level builds up to high levels.
Note that these values are based on random mating: if deliberate attempts were made specifically to avoid mating close relatives in the flock or herd, the chances of inbreeding build-up would be lessened.
Inbreeding is the most powerful tool the breeder has to establish uniform families in a population that are distinct from each other. This alters gene frequency and makes the members of the same family more likely to inherit the same genes because their parents were related. The way in which inbreeding alters the structure of a population is shown in fig. 27.

The diagram shows full-sib matings. In each case A, B and C, the lines start from an outbred stock made up of a number of separate families. The main points are:
- A: each family contributes to the next generation. It is a parallel line system.
- C: only one family is used to provide the parents for the next generation. This is a single-line system.
- B: is a compromise between A and C because inevitably some lines die out and rarely can enough parents be found in one family for the next generation. This is especially the case when inbreeding builds up, and fertility may be lowered as a result.
In practice the best aim would be to start off with many lines and end up with a few superior ones. A useful technique is to divide a flock or herd into groups and rotate sires around these sub-groups to slow down the build-up of inbreeding.
It also means that a longer working life can be obtained from an expensive purchased sire who would normally have to be disposed of after three seasons when he would mate his own daughters. He could be used for three seasons in each sub-group if no better sires became available. However, it must be remembered that this would lengthen the generation interval.
If a breeder is forced to inbreed, the benefits hegains by more effective selection will generally counteract any deficiencies caused by the slow build-up in inbreeding level. Breeders are very aware of the power of inbreeding in increasing 'pre-potency' i.e. the ability of the animal to breed stock like itself. Pre-potency will increase as the inbreeding increases.
LINEBREEDING Linebreeding is like another form of inbreeding: it is often described as slower inbreeding in which the breeder aims for the benefits while trying to avoid the troubles. It is trying to make haste slowly, or is like a ratchet mechanism holding known benefits while slowly trying to gain more merit one notch at atime. Some observers say that breeders use the term linebreeding if the results are good and call it inbreeding if the results are a disaster.
Linebreeding does not seem to have the traditional fears that are associated with inbreeding. Linebreeding is 'retrospective breeding' where for example the merit of an ancestor (now dead) has been realised, and there is urgent need to regain some of his genetic merit, the nearest of which would be that in his sons or grandsons.
It involves a deliberate concentration on a particular ancestor. If semen had been collected and stored as an insurance there would be no problem, but then this could lead to very intense inbreeding so using a near relative could be safer.
SOME GENERAL POINTSIt is highly desirable to determine the most appropriate rate of inbreeding. The points to consider have been summarised by Lush (Ref.9). The best rate of inbreeding depends on :
The skills of the breeder in his selection. The frequency of the undesirable genes in the population Any linkage between good and bad genes in the stock. The amount of dominance, espistasis and environmental effects that may deceive the breeder. The size of the population. Professor Lush considered that 6% inbreeding was the 'stop, look and listen' stage. If the breeder has to go outside his flock or herd to avoid trouble then he should first make a mild outcross to a population that has a similar programme to his own. Otherwise, all his initial progress could be severely diluted or even lost in one outcross that went wrong.
So the answer to the breeder's question whether he should inbreed would be: try to avoid it unless there is a clear reason for doing so and a plan to deal with the result whether it be successful or not. Inbreeding usually increases slowly in most flocks and herds and is reduced completely with an outcross to an unrelated sire.
SOME EXAMPLES OF INBREEDING IN ANIMALS In poultry at Iowa (USA) after 21 years of inbreeding the coefficient was 85%. Deterioration varied in each line but egg production consistently declined with inbreeding -for example 0.43% for each 1% of inbreeding coefficient. Further poultry work at Minnesota (USA) showed that after 13 years inbreeding coefficients had reached 60 to 70%. The inbreds produced fewer eggs and suffered greater mortality than the outbreds.
In pigs in the USA a large trial across the states established more than 100 inbred lines where a 30% inbreeding coefficient was reached. Inbreeding decreased litter size at birth and viability between birth and weaning. Post-weaning growth rate was also lowered by inbreeding, and inguinal hernia, cleft palate and haemophilia had appeared in the lines. The conclusion from this American work was that it seemed possible to maintain a closed herd indefinitely as long as the inbreeding coefficient did not exceed 3 to 5% per generation and if selection was applied continuously for performance traits.
Work at Edinburgh with full-sib matings in 146 lines of pigs showed that inbreeding degeneration was seen through lowered fertility and viability. Degeneration was least in the first generatons when the pigs and not their dams were inbred. It got worse when both dams and their offspring were inbred and the most highly inbred pigs were shorter in body length and fatter than their outbred controls.
In cattle, the history of the Shorthorn showed that inbreeding coefficients were zero in 1790,20% in 1825 and 26% in 1920. Bates kept the Duchess shorthorns around 40% inbreeding after about eight generations, which is probably a record in cattle.
However, the Wild White Park cattle of Chillingham in Britain must have the highest inbreeding level of all cattle although its value is unknown. The herd is a small population (13 animals in 1947 and 50in 1977) in which the use of different sires is restricted through the 'king bull' hierarchy. The king bull is the only one to serve the cows until he is beaten in battle by a younger bull.
Most modern breeds of dairy cattle are being inbred at about 0.5% per generation but where a limited number of popular bulls is used to bring about widespread improvement in performance, the inbreeding level can build up. A good example is in Denmark where the very efficient use of A1 as a breed-improvement tool in the Danish Jersey caused concentration on a few outstanding sires and rapidly built up the inbreeding level between 1915 and 1956. Here the benefits of national breed improvement were clearly weighed against the disadvantages.
Very high levels of inbreeding in cattle have been shown to reduce calf birth weight and reduce survival as well as milk and fat yield. Mature size and weight are also reduced.
In sheep most of the studies have been done on the Australian Merino and American Rambouillet.17 Inbreeding appeared to decrease all wool traits as well as fertility.
OUTBREEDING Outbreeding is the very opposite to close breeding: it is the mating of animals that are less closely related than the average of the population from which they came. It is the standard method of increasing variation, both phenotypic and genetic, in the population. The heterozygosity of the population is increased by outbreeding and as a result, general fitness and adaptation of the animal to its invironmentareusually seen. The different types of outbreeding are as follows: (a)
CROSSBREEDING Crossbreeding has always played a major role in livestock improvement. Most of the purebreds of today were the crossbreds of yesterday and the problem of defining the difference between a'crossbred' and a 'mongrel' still exists. From general usage it might be assumed that a mongrel was the result of an accident, while a crossbred was the result of a planned mating. In some traditional areas of breeding, all crossbreds are assumed to be inferior to purebreds or straightbreds. In others, the F1 cross is acceptable but all subsequent crosses appear to have mongrel status.
The first task in discussing crossbreeding is to define what is being crossed. Crosses can be made between the following: species; breeds; strains or lines; inbred lines. In crossing terminology the sire breed or individual animal is always listed first. This is important as the reciprocal cross (the opposite) may give different results.
(b) CROSSING SPECIES This has not been widely exploited inanimal production because of the technical difficulty of getting species with different numbers of chromosomes to cross. The sperm may fertilise the egg but generally embryo survival is low. If the species-cross survives to sexual maturity then it is usually sterile. However, future developments in genetic engineering could bring about changes here if there were a need to breed from the crosses.
Many species crosses are mainly of zoological interest at present, for example lion x tiger = liger. However, species crosses do have potential for animal production in difficult environments such as the very hot and the very cold areas of the world.
Examples for hot climates: Ass x Zebra = Asbra (Africa) Horse x Grevy's Zebra = Zebroid (USA) Horse x Ass = Mule
Examples for cold climates: Cattle x Buffalo = Beefalo (Canada and USA) Zebu x Yak (Himalayas)
Crosses between goats and sheep have always created interest, the result being sometimes called a 'geep'. In theory sheep and goats cannot produce viable offspring when crossed but specimens do turn up which are purported to be'geeps'. There seems to be little need to cross sheep and goats as there is sufficient genetic variation within each species already. Again it seems, to be mainly of zoological interest.
(c) CROSSING BREEDS This is the most common technique used throughout the world and is well demonstrated in the British sheep industry where hill sheep breeds (e.g. Scottish Blackface) are mated to rams of specialist 'crossing' breeds (e.g. Bluefaced Leicester) to produce breeding ewes (e.g. Greyface) for the lowland. These lowland ewes are then mated to meat-breed sires.
There are many variations of this basic system. Crossbreds generally perform better than the basic purebreds in reproductive traits. This was well demonstrated by data from 34,800 litters of pigs from 800 farms in Britain. Here purebred dams carrying crossbred piglets produced 2% more at birth, 5% more at weaning and 10% better total litter weight at weaning. When the dams themselves were crossbreds as well as their litters, they produced 5% more pigs at birth, 8% more at weaning and 11% better total litter weight weaned.
A major practical problem with crossbreeding is remembering at what stage of the cross each animal is. This means that a recording scheme is essential for parentage as well as performance. The sophistication of the scheme can vary with the aims and the needs of the breeder, but it is important to stress that the programme should be planned.
(d) CROSSING STRAINS OR LINES This is where strains, lines or families are crossed within or between populations.
(e) CROSSING INBRED LINES Here specially produced inbred lines are crossed withinapopulation. It is sometimes called in-crossbreeding.
WHAT TO DO AFTER THE FIRST CROSS (FI) Breeders are often concerned about what to do after the first (F1) cross. To which animals should the FI females be mated, to carry on the programme? There are a. number of possibilities, and in discussing these, letters are used to denote the breeds or strains involved. Here the word, 'breed' is use'd in a general sense to cover breeds, strains, lines and so on.
Here C is crossed with a sire from either A or B. This is called backcrossing, in which the breeder goes back to the original parent breeds. Inbreeding would occur if the actual parent were used again, so usually another sire of the same parent breed is chosen instead. In some animals, particularly sheep, C would be called a halfbred.
A British example is : Border Leicester x Cheviot = Scottish Halfbred An Australian example is: English Leicester x Merino = Halfbred The backcross of the halfbred to the Leicester would give a threequarter- bred (i.e. the proportion of the longwool breed dictates the cross). The backcross to the Merino (i.e. quarter longwool) would be called a 'come-back'. There are many local names for different crosses, depending on the country. 
Here a whole range of different sire breeds are used in a planned rotation. This is called 'rotational crossbreeding' and obviously can be quite complex. It is probably most commonly used in pig breeding. Such techniques are very useful in forming large reservoirs of genetic variation on which selection programmes can be imposed.
ALTERNATIVE 4 Inter-breeding (not inbreeding) the F, crossbred C. Here the population is closed and selection of male and female parents is made within it. A modification of this technique is to carry on interbreeding the females, ignoring the stage of the cross but using F, sires all the time. This has been used in sheep breeds as, for example, in the New Zealand Halfbred which is an officially recognised breed (an interbred English LeicesterX Merino).
For greatest success, interbreeding must be accompanied by positive selection. There is substantial evidence to show that, without selection, the superior performance usually found in F1 over the parent generation is reduced to 50% in the F2. Selection can be used to counteract some of the decline from the F1 to F2 and selection of the F2 can stabilise the cross. There are many examples of breeds that have been developed by this technique. Some examples are:
- Colbred sheep (Britain) -from crosses between East Friesland, Clun Forest, Border-Leicester and Dorset Horn.
- Coopworth sheep (New Zealand) - crosses of Border-Leicester and N.Z. Romney.
- Australian Milking Zebu cattle (AMZ) (Australia) - from crosses between Jersey and Zebu.
- Santa gertrudis cattle (USA) - from crosses among Shorthorn and Brahman cattle.
- Luing cattle (Scotland) - from Shorthorn and Highland cattle crossing.
- Brangus cattle (USA) - from Brahman and Angus breeds.
- Minnesota Lines of pigs (USA) -from 12 basic breeds.
OUTCROSSING A breeder makes an outcross when he brings in some new genetic variation - often called 'new blood' -into his flock or herd, and this is usually done by buying in a new sire. The magnitude of the outcross depends on how drastic a change is needed. A breeder may buy a sire from another breeder with a similar programme -this would be called a mild outcross - or he may obtain a sire fromavastly different source and make a more severe outcross. Although crossing brings in new variation, there may be an increase in the observed uniformity in the F, progeny, especially if the inbreeding level of the population had reached a fairly high level before the outcross. This observed F, uniformity may not last as the genetic variation is exploited through selection. Outcrossing may often appear to be a 'crash programme' of improvement depending on how mild or severe the outcross is. BACKCROSSING As described earlier, this is where a crossbred offspring is bred back to one of its parents, which are usually purebreds. It is often hoped that backcrossing will hold some of the benefits of the F1 cross. TOPCROSSING AND GRADING UP These two techniques are very similar. A topcross is made when a breeder goes back to the original genetic source of the breed or strain for some new genetic material. An example would be Angus breeders from Argentine or Australia returning to Perth (Scotland) to buy a stud sire. These breeders would return home with a topcross. Grading up is where one breed is changed (graded up) to another by continued crossing. It has been widely used throughout the world where 'native' stock were graded up by a number of crosses with registered sires of improved breeds. Most breed associations accept four generations of crossing with a registered sire as purebred status. A grading-up programme would work like this: 
![]() The F4 generation female that is 93.75% pure is acceptable as a purebred. This process can take many years as it relies on getting female offspring from each generation on the way through to purebred status. There are usually no performance specifications laid down in grading-up programmes. Obviously, the greatest success will be achieved by using top proven sires for both pedigree and performance. MATING LIKES Mating likes is also called 'assortative mating'. It is a very old technique and is still used today. In theory it means more than matingbest to best; it must also mean mating worst to worst and average to average. These terms 'best', 'average' and 'worst' do not always refer to productive traits: they are generally more applicable to the phenotype of the animal. It is a technique usually confined to mating best to best and is generally concerned with visual characteristics. Lush (Ref 9) warned against confusing assortative mating with inbreeding. The former is mating animals that have similar looks, while the latter is mating animals that have similar genes. He also pointed out that mating likes was not efficient in altering gene frequency compared to other selection and mating methods. MATING UNLIKES Mating unlikes is sometimes called 'negative assortative mating' or more commonly 'compensatory mating'. Here the deficiencies in the characteristics of one animal are balanced by the superior characteristics of another animal. It is a common correction technique and again refers usually to physical traits. An example would be the mating of the historically famous sheepdog 'Roy' (described as having free eye) to 'Meg' (with strong eye) to produce 'Old Hemp' in 1893. This mating by Adam Telfer was the foundation of many Border Collie strains found throughout the world today. Old Hemp was described as 'balanced' by dog men. Mating unlikes aims to 'even up' the population and exploits a lot of regression to the mean from the extremes of the traits concerned. As with mating likes, any progress made is soon lost because, after the techniques are stopped, the population quickly returns to its original state of variability under random mating. HYBRIDS AND HETEROSIS In the previous sections the terms hybrid, heterosis and hybrid vigour have deliberately not been used. This was because of the need to define them carefully to avoid the confusion found regularly in practice. The term 'hybrid' is greatly abused and extra confusion came in when commercial cornbreeding companies in the USA went on to breed poultry. The word hybrid became part of commercial trade-names as either 'hybrid' or 'hybred'. Chambers' Dictionary of Science and Technology defines a hybrid as 'the offspring of a union between two different races, species or genera;a heterozygote'. But even this is not clear enough when referring to farm animals. The basic theory is based generally on the facts that when plants or animals are crossed, provided that they differ genetically like races, species or genera, then a phenomenon called heterosis occurs. This is called positive heterosis if the offspring are better than both parents, and heterosis if the offspring are worse than both parents. It is important to remember that the genetic differences between parents should be wide to get heterosis and that either positive or negative heterosis can be expressed in the cross. Not all crosses show positive heterosis but it is this positive heterosis that is called hybrid vigour and is of special interest to animal breeders. The animal situation is further complicated because an offspring rarely is better than both parents, or an improvement on the superior parent. In farm livestock the definition of hybrid vigour is modified so that a hybrid or an animal showing hybrid vigour is one that is better than the mean of bothparents (negativethe mid-parent mean). This is summarised in a diagram in fig. 28.
The F4 generation female that is 93.75% pure is acceptable as a purebred. This process can take many years as it relies on getting female offspring from each generation on the way through to purebred status. There are usually no performance specifications laid down in grading-up programmes. Obviously, the greatest success will be achieved by using top proven sires for both pedigree and performance. MATING LIKES Mating likes is also called 'assortative mating'. It is a very old technique and is still used today. In theory it means more than matingbest to best; it must also mean mating worst to worst and average to average. These terms 'best', 'average' and 'worst' do not always refer to productive traits: they are generally more applicable to the phenotype of the animal. It is a technique usually confined to mating best to best and is generally concerned with visual characteristics. Lush (Ref 9) warned against confusing assortative mating with inbreeding. The former is mating animals that have similar looks, while the latter is mating animals that have similar genes. He also pointed out that mating likes was not efficient in altering gene frequency compared to other selection and mating methods. MATING UNLIKES Mating unlikes is sometimes called 'negative assortative mating' or more commonly 'compensatory mating'. Here the deficiencies in the characteristics of one animal are balanced by the superior characteristics of another animal. It is a common correction technique and again refers usually to physical traits. An example would be the mating of the historically famous sheepdog 'Roy' (described as having free eye) to 'Meg' (with strong eye) to produce 'Old Hemp' in 1893. This mating by Adam Telfer was the foundation of many Border Collie strains found throughout the world today. Old Hemp was described as 'balanced' by dog men. Mating unlikes aims to 'even up' the population and exploits a lot of regression to the mean from the extremes of the traits concerned. As with mating likes, any progress made is soon lost because, after the techniques are stopped, the population quickly returns to its original state of variability under random mating. HYBRIDS AND HETEROSIS In the previous sections the terms hybrid, heterosis and hybrid vigour have deliberately not been used. This was because of the need to define them carefully to avoid the confusion found regularly in practice. The term 'hybrid' is greatly abused and extra confusion came in when commercial cornbreeding companies in the USA went on to breed poultry. The word hybrid became part of commercial trade-names as either 'hybrid' or 'hybred'. Chambers' Dictionary of Science and Technology defines a hybrid as 'the offspring of a union between two different races, species or genera;a heterozygote'. But even this is not clear enough when referring to farm animals. The basic theory is based generally on the facts that when plants or animals are crossed, provided that they differ genetically like races, species or genera, then a phenomenon called heterosis occurs. This is called positive heterosis if the offspring are better than both parents, and heterosis if the offspring are worse than both parents. It is important to remember that the genetic differences between parents should be wide to get heterosis and that either positive or negative heterosis can be expressed in the cross. Not all crosses show positive heterosis but it is this positive heterosis that is called hybrid vigour and is of special interest to animal breeders. The animal situation is further complicated because an offspring rarely is better than both parents, or an improvement on the superior parent. In farm livestock the definition of hybrid vigour is modified so that a hybrid or an animal showing hybrid vigour is one that is better than the mean of bothparents (negativethe mid-parent mean). This is summarised in a diagram in fig. 28.  It is important to stress that in measuring heterosis, is all the animals (i.e. both the parents and the offspring) should be compared in the same environment. Often crossbreds are produced to perform under different conditions to the parents, and in this case it should not be inferred that the crossbreds exhibit hybrid vigour unless they were properly tested in a common environment. So often, crosses between breeds do not show hybrid vigour as defined above; their performance often equals the midparent mean. Hybrid vigour is usually at its maximum in the F1 and then is halved in each subsequent backcross to either parent. The breeder's term of 'nicking' can also complicate the discussion of heterosis when it is used to denote hybrid vigour. It is often used in crosses between families or breeds where no real hybrid vigour occurs: it may be used by breeders to describe a successful mating. Nicking, however, is an important phenomenon and is covered under 'combining ability'. Some general estimates of how much extra production can come from hybrid vigour are shown in table 13.
![]() COMBINING ABILITY - GENERAL AND SPECIFIC This subject mainly applies to poultry breeding and has not been widely used in large farm animals. It really covers some further methods of selection for conditions where non-additive genetic variation is more important than the additive portion. This is where the D and I components are more important than the G component in the equation shown earlier. Here dominance and epistasis are exploited to produce commercial hybrids. Lerner (Ref 20) classified selection into: (a) Intra-population selection i.e. within a population. (b) Inter-population selection i.e. between populations. This is shown in fig. 29 wherea population ismadeup of separatestrains or lines, often referred to as genetic isolates. There are three isolates called strains A, B and C that are present at the start of the programme (generation 0). On the basis of a test for appropriate traits, A and B are kept and C is discarded. Then at generation 1, there are A, B and the newly-introduced strain D. On the basis of a test A is discarded so that B and D go on to the next generation and join E, the newly introduced strain. In generation 2, B is discarded and so on. The main point is to determine how each strain is selected. This can be done by progeny testing within each strain where the best sires are used and the worst culled. This then keeps the strain going. Generation intervals are long because the progeny from the progeny test are not used for breeding. The next step is to cross the strains in all possible combinations (and their reciprocals) to see which ones could be marketed as useful hybrids. These programmes can become very complex and are used where the lines are fairly inbred. One important method is called 'Recurrent selection' (or RS) where selectionis carried out in one line on the basis of its cross performance withanother line (usually inbred). This inbred line is regarded as a constant. 'Reciprocal Recurrent Selection' (or RRS) is another method based on intra-population selection using test-cross performance lines. Thus in all these programmes the breeder may find a strain, a family, or even an individual that gives good results when crossed with all the others. This is a general combining ability. Alternatively, a strain, line or individual may only produce good results with certain others: this is specific combining ability. Both these types of combining ability are used to produce commercial hybrids. It is easy to accept that hybrid poultry are not worth breeding from as their merits are not guaranteed to be passed on. A commercial hybrid is a 'disposable' product and has an air of planned obsolescence associated with it. It should be used and then thrown away for a better model the following year. This attitude of commercial poultry breeders ensures that breeders face a continuing challenge.
COMBINING ABILITY - GENERAL AND SPECIFIC This subject mainly applies to poultry breeding and has not been widely used in large farm animals. It really covers some further methods of selection for conditions where non-additive genetic variation is more important than the additive portion. This is where the D and I components are more important than the G component in the equation shown earlier. Here dominance and epistasis are exploited to produce commercial hybrids. Lerner (Ref 20) classified selection into: (a) Intra-population selection i.e. within a population. (b) Inter-population selection i.e. between populations. This is shown in fig. 29 wherea population ismadeup of separatestrains or lines, often referred to as genetic isolates. There are three isolates called strains A, B and C that are present at the start of the programme (generation 0). On the basis of a test for appropriate traits, A and B are kept and C is discarded. Then at generation 1, there are A, B and the newly-introduced strain D. On the basis of a test A is discarded so that B and D go on to the next generation and join E, the newly introduced strain. In generation 2, B is discarded and so on. The main point is to determine how each strain is selected. This can be done by progeny testing within each strain where the best sires are used and the worst culled. This then keeps the strain going. Generation intervals are long because the progeny from the progeny test are not used for breeding. The next step is to cross the strains in all possible combinations (and their reciprocals) to see which ones could be marketed as useful hybrids. These programmes can become very complex and are used where the lines are fairly inbred. One important method is called 'Recurrent selection' (or RS) where selectionis carried out in one line on the basis of its cross performance withanother line (usually inbred). This inbred line is regarded as a constant. 'Reciprocal Recurrent Selection' (or RRS) is another method based on intra-population selection using test-cross performance lines. Thus in all these programmes the breeder may find a strain, a family, or even an individual that gives good results when crossed with all the others. This is a general combining ability. Alternatively, a strain, line or individual may only produce good results with certain others: this is specific combining ability. Both these types of combining ability are used to produce commercial hybrids. It is easy to accept that hybrid poultry are not worth breeding from as their merits are not guaranteed to be passed on. A commercial hybrid is a 'disposable' product and has an air of planned obsolescence associated with it. It should be used and then thrown away for a better model the following year. This attitude of commercial poultry breeders ensures that breeders face a continuing challenge. 


